The binomial symptom index: toward an optimal method for the evaluation of symptom association in gastroesophageal reflux
Abstract
Background
The evaluation of symptom association in gastroesophageal reflux is an open problem. The scientific literature reports important deficiencies and clinicians are claiming a new methodology. This article provides an optimal method for the evaluation of symptom association, the binomial symptom index (BSI).
Methods
A mathematical description of the BSI was presented for the study of association and causality. A total of n = 850 000 patients were simulated using a Monte Carlo model to perform a two-way sensitivity analysis. The average and the standard deviation of the BSI were evaluated in groups of 5000 patients with the same values of the reflux rate, symptom rate, association ratio, window of association, and monitoring time in order to contrast their influence on the estimator.
Key Results
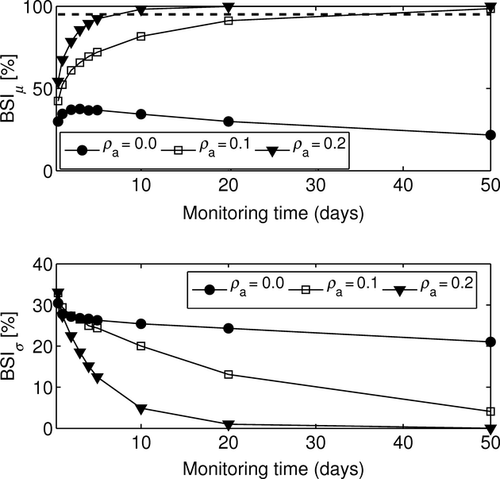
The BSI decreased with the number of reflux episodes when there was association, and remained constant and below 40% when there was not. The standard deviation was no higher than 40% and decreased with the reflux or symptom rates, and more sharply with the monitoring time, reaching approximately 0% for 50 days. A window length matching the characteristic reflux-symptom lag maximized the overall BSI and minimized its dispersion. Twenty-four hour and 96-h monitorings allowed detecting association ratios of 50% and 25%, respectively.
Conclusions & Inferences
The BSI is a simple and reliable index for the evaluation of symptom association that considers all the parameters under analysis. Defining an appropriate cut-off value, the BSI can provide a measure of probability and strength of association simultaneously.
Abbreviations
-
- BSI
-
- binomial symptom index
-
- GER
-
- gastroesophageal reflux
-
- GERD
-
- gastroesophageal reflux disease;
-
- SAA
-
- symptom association analysis
-
- SAP
-
- symptom association probability
-
- SI
-
- symptom index
-
- SSI
-
- symptom sensitivity index
Introduction
Gastroesophageal reflux (GER) occurs physiologically in patients of all age groups. GER disease (GERD) is the result of the existence of symptoms and complications associated with GER.1, 2 It affects about 20% of the western population3 and represents a potential cause of neonatal death.4 Symptom association analysis (SAA) has been a subject of research for more than 20 years without achieving a solid conclusion.5-7 It is currently an important area of debate8-13 as some invasive therapies are being applied as the result of the evaluation of symptom association.
The occurrence of reflux episodes and acute symptoms (cough, bradycardia, apnea, etc.) can be assumed, a priori, to be two statistically independent phenomena unless the contrary is proved. In this way, different indices were suggested to determine the degree of association between reflux and symptom events: the symptom index (SI),5 the symptom sensitivity index (SSI),14 and the symptom association probability (SAP). 15 The SI does not consider the total number of reflux episodes, the SSI failed for not considering the total number of symptoms, and neither takes into account the effect of chance.16 The SAP appeared to overcome these problems although it has recently shown important deficiencies: it changes abruptly over the width of the window of association9 and increases with the length of monitoring.17, 18 These indices are normally utilized in clinical evaluation of GERD rising important concerns: physicians are lacking a simple and reliable symptom association index.19
In some studies,7, 9, 20 a small number of patients represent a problem when looking for representative sample of the population. On the other hand, in silico methods have recently proved to be of relevant utility when assessing the goodness of SAA because they provide enough data to draw solid conclusions.16, 17 Monte Carlo simulations allow generating unlimited amounts of virtual patients with well known statistical features. This improves research in this field as it may help predicting the clinical outcomes.
The binomial symptom index (BSI) was first presented by Ghillebert et al.21 This index fell on deaf ears due to its apparent, but unreal, mathematical complexity.22 This study proves this index to be an optimal estimator for symptom association by means of computational techniques. The BSI overcomes the limitations of the current gold standard, the SAP, and provides a reliable measurement of symptom association. This index considers all the parameters involved in symptom association and can provide simultaneously a measure of probability and strength of association (effect of size) when the cut-off value is defined appropriately. Its goodness was tested computationally against different parameters by means of Monte Carlo simulations as described in the scientific literature.16
Methods
Reflux and symptom occurrences can be considered as two independent arrival processes.16 In some occasions, there may be correlation between both events and therefore a positive association. Reflux and symptom episodes are generally considered to be associated if the temporal lag between both events lies within a given window of association. Thus, if the lag is considered in one direction only, causality may be studied using this method.
The binomial symptom index
The BSI represents the probability of symptom association. It was described to be applied to pH-metry studies only.21 However, intraluminal impedance technique improves reflux detection and therefore, it needs to be adapted by defining a new area of association.
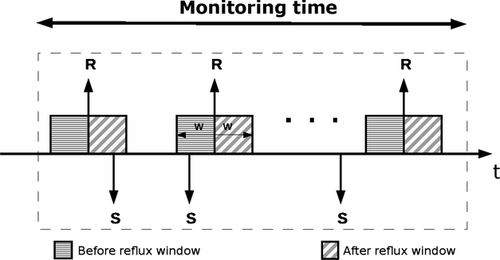
Firstly, the onset of all reflux episodes must be identified accurately.23 A general window of association of length w is defined to assess either, association or causality. Fig. 1 represents an example of the evaluation of a GER study. The ‘area before reflux’ represents the temporal location where a symptom is considered the cause of the reflux episode. On the other hand, the ‘area after reflux’ determines the temporal location where a reflux episode is considered to cause the symptom. If one aims to simply evaluate temporal association, both time intervals, together, should be taken into account. Otherwise, association would be tested in one direction only. By defining the area of association, the researcher can choose between unidirectional and bidirectional analysis.
 (1)
(1) (2)
(2) (3)
(3) (4)
(4)Monte Carlo simulations
To test the BSI, a Monte Carlo model was implemented according to scientific literature.16 This model assumes that reflux and symptom arrivals are distributed following a Poisson process. The model is characterized by the reflux rate λR, the symptom rate λS, the association ratio ρa, and the monitoring time T. The reflux and symptom rates represent the overall number of events per day. The association ratio is the proportion of those symptoms that are generated as associated. Note that reflux-related symptoms were simulated with equal probability around the onset of a given reflux episode within 120 s. This model was used for a two-way sensitivity analysis of the BSI, that is, the influence of two parameters at a time. For this purpose, 5000 virtual patients were generated for each combination of parameters according to Table 1. This allows obtaining statistically significant results (P < 0.01) as well as smooth curves. A personal computer (Intel® Pentium® (Intel Corporation, Santa Clara, CA, USA) Dual Core 2 GHz) was used for the simulations running Matlab 2008 under Ubuntu 10.4. The average (BSIμ) and the standard deviation (BSIσ) of the index were calculated and plotted against the main parameter under study. Note that parameters in Table 1 were considered to mainly describe a pediatric population (70 reflux and 10 symptoms in 24 h).9, 10, 24 However, the range of variation allows analyzing the statistical characteristic of adult patients as well, in occasions with lower reflux and symptom rates.
| Parameter | Range of variation | Other parameters | |||
|---|---|---|---|---|---|
| Reflux rate (λR) | 20–200 (GER/day) | λS = 10 | w = 120 | T = 1 | ρa = [0, 0.25, 0.5] |
| Symptom rate (λS) | 5–40 (symptom/day) | w = 120 | T = 1 | ρa = 0.0 | λR = [30, 70, 100] |
| Monitoring time (T) | 0.5–50 (days) | λR = 70 | λS = 10 | w = 120 | ρa = [0, 0.1, 0.2] |
| Window length (w) | 20–300 (s) | λR = 70 | λS = 10 | T = 1 | ρa = [0, 0.25, 0.5] |
| Association ratio (ρa) | 0.0–0.5 | λR = 70 | λS = 10 | w = 120 | T = [0.25, 0.5, 1, 4] |
- a The table represents the range or variation in the parameters used in the computational model.
Results
A total of 850 000 virtual patients were studied and evaluated including simulations from 6 h to 50 days of duration. The influence of different parameters was analyzed and described according to Table 1. A positive association was considered when BSI ≥ 95%.
Reflux rate
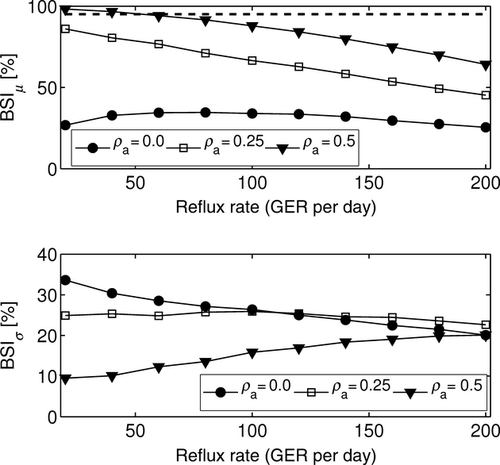
Higher reflux rates increased the likelihood of a symptom to be associated with a reflux episode by chance. Therefore, the value of the index tends to decrease linearly with higher reflux rates, as shown in Fig. 2. However, it remained approximately constant and below 40% when the association ratio was zero. The standard deviation, in all cases, remained below 35% and converged to 20% for a reflux rate of 200 episodes/day.
Symptom rate
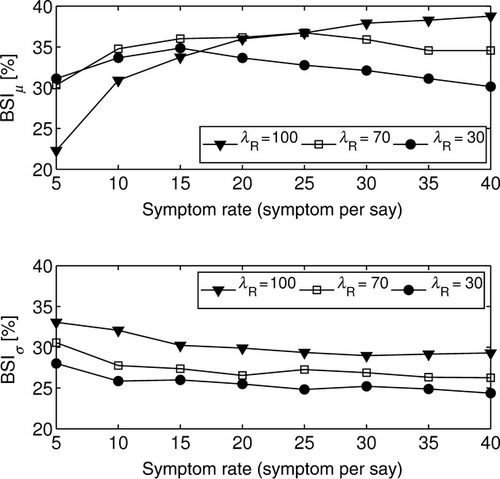
Similarly, high symptom rates increased the total number of reflux-related symptoms by chance. However, it did not represent an increase in the overall value of the BSI; it reached a maximum and then tended to decrease. When there was no association (ρa = 0), the value of the index was BSIμ < 40%. On the other hand, the standard deviation remained constant and approximately between 25% and 30% as in Fig. 3. However, the higher the reflux rate, the higher the dispersion, as noted previously.
Monitoring time
When there was no association (ρa = 0), the mean of the BSI decreased over monitoring time and remained below 50%. On the other hand, for ρa > 0, the BSIμ reached the 100% value for sufficiently large monitoring times. Thus, the longer the recording, the more positive the value of the index. In addition, longer durations of the study provided more confidence on the value of the index because more information was considered. This can be observed in Fig. 4. Note the density of simulations was greater between 12 h and 5 days, as these monitoring lengths are of real clinical application. However, as the monitoring time increases, the density decreases because the interest of these simulations becomes of academic interest only.
Window length
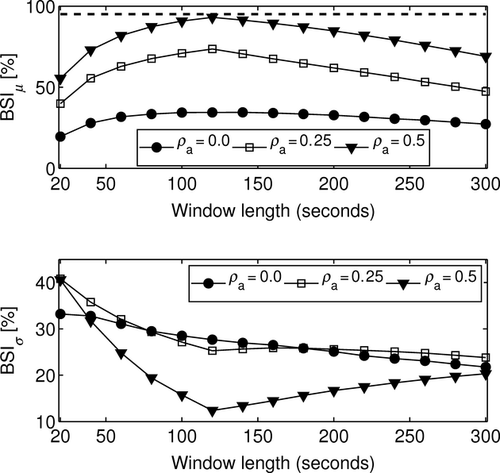
A null association ratio made the index to remain approximately constant (BSIμ < 40%) while decreasing the variability. However for ρa > 0, the index reached a maximum at the characteristic symptom-reflux lag whereas the variability reached a minimum at the same value. Note in these simulations, the temporal lag was set to 120 s, so that the extremes of the curves appeared at that value, as in Fig. 5. In particular, for an association ratio ρa = 0.5, an appropriate matching of the length of the window can reduce the BSIσ from approximately 40% to slightly more than 10%.
Association ratio
Higher association rates provided higher values of the index and lower variability (see Fig. 6). For 24-h monitoring, the 95% threshold was reached for an association ratio of approximately ρa = 0.5. On the other hand, when 96-h monitoring times were analyzed, the index was able to detect associations as weak as ρa = 0.3 with lower variability (BSIμ < 10%). Note that for monitoring times below 12 h, 70 reflux and 10 symptoms per 24 h, association cannot be detected whereas dispersion remains above 10%.

Discussion
Symptom association still remains unclear. Some scientists have raised important concerns regarding the current indices because they do not provide a clear and accurate assessment of reflux-symptom association.9, 10, 16-19 Nevertheless, physicians are still using them despite their lack of reliability, which may lead to erroneous clinical decisions involving invasive treatments such as surgical procedures. In this scenario, clinicians are looking for a simple evaluation method.19 The SAP index is still considered as the gold standard despite all its deficiencies: it is monotonically increasing over time16 and changes abruptly with small variations of the window size.9 In addition, dividing the study in fixed windows produces a random effect on the value of the SAP so that its result will depend randomly on the instant the study begins.
The BSI represents a solid, stable and reliable alternative for the evaluation of symptom association. This study suggests adapting the area of association defined by the BSI to match the current methodology, based mainly on the analysis of multiple intraluminal impedance and pH-metry. It also provides a comprehensive description of the index by means of computational simulations16 and analyzes the effects of varying any parameter involved. In silico analysis represents an important preliminary validation. However, the BSI, as presented in this study, must be confirmed in clinical studies as a predictive outcome of reflux therapy before it can be widely adopted.
The BSI is a versatile and flexible index as it allows the evaluation of both, unidirectional and bidirectional temporal association. In doing so, the value of the probability of association pa should be calculated as described previously choosing the more convenient area of association. This area may be defined in different ways to provide further information. For example, it can be considered before, during and after the reflux episode although it would increase complexity. Note that in some cases, the area around two different reflux episodes might overlap. Nevertheless, considering there is no overlap is a more conservative approach and represents a good approximation. On the contrary, duplicated symptoms (e.g. key pressed repeatedly) must be censored, either by the physician or by an automatic system, as it would alter the result of the index. Nevertheless, this is not a limitation related to the definition of the index because it is produced by the way symptoms are reported.
An increased reflux rate enhances association by chance. Similarly, an increased symptom rate will also increase the overall number of reflux-related symptoms. Both premises are taken into account by the BSI. In other words, no matter how high the reflux and symptom rates are, if there is no association, the result of the index will remain no higher than chance. On the other hand, if an association exists, no matter how low it is, the BSI will grow with the amount of information, that is, the reflux rate, the symptom rate or the duration of the monitoring. Therefore, there is a minimum amount of information required to be able to detect symptom association. In pediatric patients suffering from cardiorespiratory episodes, due to the severity of these symptoms, the existence of symptom association, no matter how strong the association is, represents a criterion for medical treatment. Moreover, different treatments may be considered depending on the direction of the association. However, in adults suffering from less severe symptoms, the measurement of the size of effects is required along with the probability of association.
The width of the window plays an important role as well. If there is an association, there will be a lag between the reflux and the symptom. This lag should be defined for different pathologies. Nevertheless, it has not been clearly described and different windows (15 s to 10 min) have been utilized so far.9, 10, 20, 25 This work proves that the BSI provides the maximum accuracy when the window length matches the characteristic reflux-symptom lag. Hence, there is a need to reach agreement when investigating different symptoms, as different pathologies will exhibit, a priori, different characteristic symptom-reflux lags. In this study, associated events were simulated with an average temporal delay of 120 s. Similar results would have been obtained if other lags had been simulated, and therefore, this study only concludes that the optimal window is the one that matches the characteristic temporal delay of a given pathology.
The association ratio describes the proportion of the total number of symptoms that are related not by chance. On the other hand, the SI represents the proportion of reflux-related symptoms including those related at random. In Fig. 6, one can appreciate how for 24-h monitoring, the index is able to detect association when the association ratio is about 50%. Note that this value matches approximately the threshold of significance of the SI described in clinical studies.26 Moreover, increasing the duration of the monitoring allows detecting weaker associations. This may be of useful application as wireless technology extends investigations from 24 h to up to 96 h18 and therefore associations, as weak as 30%, could be detected by the BSI. Note that if an appropriate cut-off value is defined, this index will also ensure a minimum effect of size. For example, a more conservative approach such as a 99% threshold ensures that recordings below 24 h of duration will exhibit an association rate of at least 50%. This idea may be of useful application when assessing incomplete studies because the BSI considers not only the number of associated events but also the monitoring time. Therefore, the minimum monitoring time required to estimate symptom association depends on the total amount of information.
In conclusion, BSI is an easy-to-use index that allows evaluating unidirectional and bidirectional symptom association. It takes into account all the parameters involved in the assessment of symptom association. If a 99% threshold is considered, then the BSI will provide, simultaneously, a measure of probability and effect of size of at least 50% in 24-h monitoring studies. On the other hand, when evaluating the probability of association only, this threshold may be relaxed as longer monitoring times become available.
Funding
This project (PI-0434-2010) was supported by the Department of Health of the Regional Government of Andalusia, Spain.
Disclosures
ABR designed the study, performed the acquisition, analysis and interpretation of data, and drafted the article; ME revised the article critically for important and intellectual content; MM helped with the analysis and interpretation of data; MLP revised the article critically for important and intellectual content and approved the final version of the manuscript to be published. Competing Interests: the authors have no competing interests.
Appendix
The BSI can be easily integrated within any software application. The following represents the source code of a simple c program for the calculation of the BSI. It consists of two functions, one calculates the factorial of a given number, and the other returns the value of the index. This function receives the number of reflux (Nr), the number of symptoms (Ns), and the number of reflux-related symptoms (Na). For a given window length (w) and a monitoring time (T), it calculates the value of the BSI.
-
#include <math.h>
-
/* This function returns the value of the Binomial Symptom Index.*
-
float BSI(float Nr, float Ns, float Na, float w, float T)
-
{
-
float p_value=0;
-
float i=Na;
-
for (i; i<=Ns; i++)
-
p_value+=factorial(Ns)/(factorial(i)*factorial(Ns-i))*pow((Nr*w)/T,i)*pow(1-(Nr*w)/T,(Ns-i));
-
return(100-p_value*100);
-
}
-
/*Returns the factorial of the given parameter n*/
-
float factorial(int n)
-
{
-
return (n == 1 || n == 0) ? 1 : factorial(n - 1) * n;
-
}


